Chapter 2 Sampling Intensity
Principles:
Our goal is to describe natural properties of vegetation. We choose protocols according to how efficiently or accurately they perform in measuring vegetation properties. Databases should be constructed around these natural properties, not around protocols.
Our descriptions are independent of aspirations of the land owner (land use) and regulatory status of vegetation. Though we may accommodate different users who need specific properties to be measured, we do not need to know how a given user would use the data in order for the minimum data set to be collected.
All vegetation will share a basic set of natural properties, while some other properties may be life form specific (e.g. stem diameter and basal area for trees). All vegetation has three classes of properties: species composition; an abundance measure; and a structure or height value. Abundance measures can be canopy cover, foliar cover, biomass, and frequency, but each is a different property which may entail different protocols to measure. USNVC considers canopy cover is the most universal form of abundance to record, while other forms of abundance are favored by specialized end users.
Adjusting the intensity and speed of vegetation inventory should consider this order of priority.
2.1 Observation Intensity
Scouting
Nonsystematic observations intended to develop hypotheses or to justify a return trip, not recorded as data.
Low Intensity (Reconnaissance)
Systematic observation with enough detail to diagnose community type, and record as point data, but not enough to fully characterize structure and composition. May include collection of one or more data elements found in higher intensity observations, but not enough to completely characterize structure and composition. May focus on dominant species (accounting for a cumulative 50% cover), total cover by lifeform, species basal area by variable radius plot, total species inventory by fixed plot area, line point intercept foliar cover transects, etcetera. These separate elements may inform community summaries of these attributes even if by themselves they are incomplete records of vegetation.
Medium Intensity
Systematic observation with enough detail to characterize complete structure and composition. This is generally resolved as cover in two or more strata. All species with more than 1% cover are identified where possible.
High Intensity
Systematic observation with enough detail to characterize complete structure and composition resolved in higher resolution, and with additional data elements. Resolution is generally as cover in three or more strata and live canopy height, with additional data elements such as basal area, diameter, age, biomass, down woody debris, snag density, etc. recorded as needed. All species are identified where possible.
2.2 General Protocol
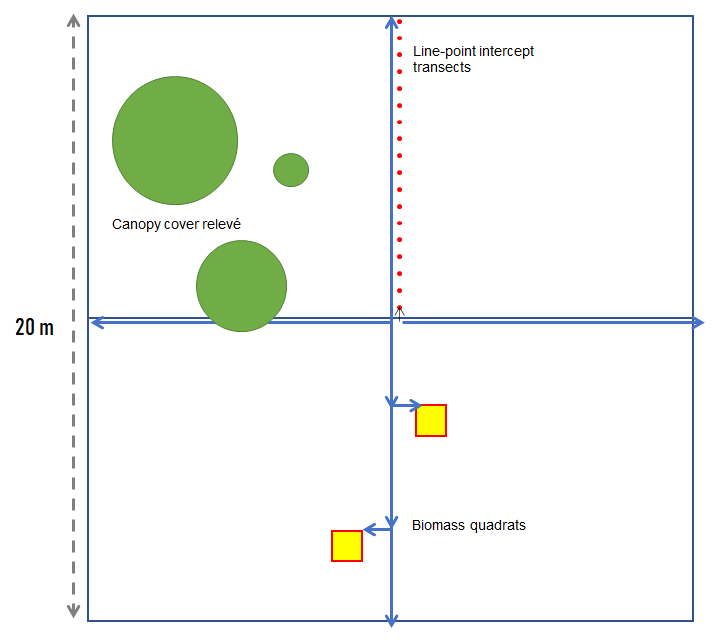
- Delineate plot layout. The main plot is called a “macroplot” if subsampled with quadrats and transects. If limited in number of plots, position plot to be representative, avoiding stand boundaries unless heterogeneity is a recurring pattern that cannot be avoided by chosen plot size. While plot size could be adjusted to grain of reoccurring patterns (i.e. species area saturation curve), it is also useful to maintain a consistent scale for the species frequency metric. Other methods that go beyond a delineated plot (e.g. long transects or zigzag methods) can also be used if the goal is to characterize a whole stand or a community type. In this context the plot would represent just a sample unit of the whole. However, when the plot is paired and analyzed with a pedon record, the emphasis should be on the plot as an integrated unit representing a point on the landscape, and methods that stray from the point location should be avoided. An exception is made for variable radius plots where large trees are often counted outside the macroplot, but are often species that are represented in the understory or have large enough crowns to overlap the plot.
- Estimate total canopy cover by stratum and lifeform. At minimum, there is an overstory and an understory at 5 m, and non-epiphytic herbaceous plants are tallied as part of the lowest stratum (the rationale being that they die back to the lowest stratum each year). This data will be used to classify structure into basic vegetation type and to calibrate subsequent ocular estimates of plant species abundance.
- Begin exhaustive species checklist within the boundaries of the plot. If a species is unknown, classify it to nearest, genus, family, or lifeform to ensure that gets accounted for in aggregated analyses. Preferably list species represented in the highest strata first (grouping species sharing strata facilitates data entry), but species discovery is an iterative opportunistic process making absolute control of order impossible. A variable radius plot can be conducted first to establish ordering priority.
- If there are trees greater than 10 cm in diameter at a height of ~1.37 m, assess basal area. Measure diameters if needed.
- Measure the heights of the tallest trees to calibrate subsequent stratum heights.
- Assess the cover of each species in each stratum. Generally, start from the top down, and remember to note whether the same species occurs in lower strata. Highest cover value cannot exceed the total cover for the stratum for which it is a member. Cover of species in the tree stratum can be proportioned according to their basal areas, though some species can be disproportionately more prolific in their crowns relative to their basal areas.
- Consider seedling and sapling stem density. If species recruitment is important, define cohort by stem diameter or stratum, count number of individuals by species cohort in subplots.
- If stand age or site index is important, core representative trees and count rings.
- If the density and richness of understory vegetation is high and it is difficult to get accurate ocular estimate of cover or if foliar cover is a needed metric, consider line point intercept transects. For dense intermingling plants, the distinction between canopy cover and foliar falls apart. Ensure that any additional species found are recorded in for the macroplot species list. Use foliar cover values to recalibrate ocularly estimated cover if large discrepancy exists, though transects usually do not capture every species in the macroplot.
- If aboveground biomass or productivity data is needed, consider harvesting and weighing quadrats. Dry weights require that samples be saved and weighed after air drying. Depending on user need and time available and stand richness, weights are resolved to lifeform or species. Samples can also be stratified between direct measurement and estimated units.
Additional options for dead structure
Basal area should include snags >10 cm wide and >2 m tall.
A ground surface cover transect should be used to assess down woody debris and leaf litter coverage (litter thickness?). Line-point intercepts (e.g. intervals of half a meter) can be done to estimate smaller woody debris and leaf litter, whereas a continuous line intercept may be more efficient for assaying larger woody debris (> 10 cm). The two methods need to be talleyed separately before the percentage cover totals are combined.
Additional options for carbon sequestration potential/productivity and grazing
Biomass and/or annual biomass for productivity.
Foliar cover from line-point intercept transect of vegetation less than 2 m tall.