Chapter 9 Structure
This analysis using vegnasis package explores vegetation structure.
9.1 Data Processing
# remotes::install_github("phytoclast/vegnasis", dependencies = FALSE)
library(vegnasis)
library(ggplot2)

veg.raw <- vegnasis::nasis.veg
# With a connection to NASIS via soilDB...
# veg.raw <- soilDB::get_vegplot_species_from_NASIS_db()

veg <- clean.veg(veg.raw)
#These tasks fill in missing plant 'types' and establishes the crown heights based on user inputs of stratum, live canopy heights, and taxon norms when user data is missing.
veg <- veg |> fill.type.df() |> fill.hts.df()
#Select only Wexford County Michigan records.
veg <-  veg |> subset(grepl('MI165',plot))
9.2 Structure Summary
veg.structure <- veg |> get.structure()

knitr::kable(
  veg.structure, booktabs = TRUE,
  caption = 'A table with estimating structure of each plot.'
)| plot | tree | shrub | herb | moss | ht.max | structure |
|---|---|---|---|---|---|---|
| 2022MI165001.P | 95.3 | 17.8 | 15.4 | 0.0 | 20 | forest |
| 2022MI165002.P | 95.1 | 4.5 | 8.7 | 0.0 | 20 | forest |
| 2022MI165003.P | 90.1 | 15.0 | 16.6 | 5.9 | 20 | forest |
| 2022MI165004.P | 95.0 | 77.2 | 13.2 | 0.0 | 21 | forest |
| 2022MI165005.P | 29.6 | 7.3 | 94.4 | 0.0 | 31 | woodland |
| 2022MI165006.P | 80.0 | 99.1 | 11.0 | 0.0 | 26 | forest |
| 2022MI165007.P | 95.2 | 27.6 | 2.2 | 0.0 | 31 | forest |
| 2022MI165008.P | 95.0 | 77.5 | 10.7 | 0.0 | 29 | forest |
| 2022MI165009.P | 95.0 | 26.1 | 52.8 | 0.0 | 31 | forest |
| 2022MI165010.P | 70.3 | 54.4 | 68.3 | 64.0 | 25 | forest |
| 2022MI165011.P | 79.5 | 26.2 | 87.0 | 5.0 | 20 | forest |
| 2022MI165012.P | 30.2 | 40.7 | 73.9 | 0.0 | 24 | woodland |
| 2022MI165013.P | 54.5 | 86.0 | 56.7 | 0.0 | 19 | woodland |
| 2022MI165014.P | 70.2 | 69.4 | 49.3 | 10.7 | 21 | forest |
| 2022MI165015.P | 14.5 | 43.0 | 82.6 | 0.0 | 23 | savanna |
| 2022MI165016.P | 80.4 | 62.5 | 46.9 | 2.0 | 24 | forest |
| 2022MI165017.P | 36.0 | 82.4 | 30.7 | 2.0 | 20 | woodland |
| 2022MI165018.P | 74.6 | 70.2 | 31.3 | 0.0 | 25 | forest |
| 2022MI165019.P | 91.4 | 45.1 | 46.7 | 0.2 | 35 | forest |
| 2022MI165020.P | 64.2 | 20.9 | 87.9 | 90.5 | 20 | forest |
| 2022MI165021.P | 73.2 | 37.4 | 73.9 | 5.9 | 25 | forest |
| 2022MI165022.P | 72.2 | 22.8 | 55.5 | 0.0 | 26 | forest |
| 2022MI165023.P | 72.2 | 22.3 | 75.5 | 0.2 | 35 | forest |
| 2022MI165024.P | 78.7 | 39.2 | 85.3 | 0.0 | 27 | forest |
| 2022MI165025.P | 60.6 | 24.9 | 88.2 | 5.0 | 22 | forest |
| 2022MI165026.P | 31.9 | 77.4 | 95.1 | 0.0 | 20 | woodland |
| 2022MI165027.P | 98.6 | 20.8 | 4.2 | 0.0 | 30 | forest |
| 2022MI165028.P | 95.6 | 39.8 | 8.0 | 0.0 | 22 | forest |
| 2022MI165029.P | 95.2 | 57.0 | 7.4 | 0.0 | 26 | forest |
| 2022MI165030.P | 95.2 | 5.0 | 29.2 | 0.0 | 20 | forest |
| 2022MI165031.P | 98.6 | 42.8 | 18.3 | 0.2 | 21 | forest |
| 2022MI165032.P | 97.9 | 15.5 | 20.1 | 0.0 | 26 | forest |
| 2022MI165033.P | 79.9 | 42.0 | 99.3 | 0.0 | 22 | forest |
| 2022MI165034.P | 91.8 | 57.8 | 0.6 | 0.0 | 30 | forest |
9.3 Structure Profile
veg.str <- summary.crown.thickness(veg, breaks = c(c(-1:9)/10,c(2:100)/2)) |> structure.fill.zero() |> subset(type %in% c('tree', 'shrub/vine', 'grass/grasslike',  'forb'))
veg.str.pct <- veg.str |> group_by(type, stratum, stratum.label, bottom, top) |>
  summarise(X25 = quantile(Cover, 0.25),
            X50 = quantile(Cover, 0.5),
            X75 = quantile(Cover, 0.75))

knitr::kable(
  head(veg.str, 25), booktabs = TRUE,
  caption = 'A table of the first 25 rows of the veg.str data.'
)| plot | type | stratum | stratum.label | bottom | top | Cover |
|---|---|---|---|---|---|---|
| 2022MI165001.P | forb | 2 | -0.1-0 | -0.1 | 0.0 | 6.9 |
| 2022MI165001.P | forb | 3 | 0-0.1 | 0.0 | 0.1 | 7.0 |
| 2022MI165001.P | forb | 4 | 0.1-0.2 | 0.1 | 0.2 | 1.2 |
| 2022MI165001.P | forb | 5 | 0.2-0.3 | 0.2 | 0.3 | 1.0 |
| 2022MI165001.P | forb | 6 | 0.3-0.4 | 0.3 | 0.4 | 1.0 |
| 2022MI165001.P | forb | 7 | 0.4-0.5 | 0.4 | 0.5 | 6.9 |
| 2022MI165001.P | forb | 8 | 0.5-0.6 | 0.5 | 0.6 | 6.0 |
| 2022MI165001.P | forb | 9 | 0.6-0.7 | 0.6 | 0.7 | 6.0 |
| 2022MI165001.P | forb | 10 | 0.7-0.8 | 0.7 | 0.8 | 6.0 |
| 2022MI165001.P | forb | 11 | 0.8-0.9 | 0.8 | 0.9 | 6.0 |
| 2022MI165001.P | forb | 12 | 0.9-1 | 0.9 | 1.0 | 6.0 |
| 2022MI165001.P | grass/grasslike | 2 | -0.1-0 | -0.1 | 0.0 | 0.0 |
| 2022MI165001.P | grass/grasslike | 3 | 0-0.1 | 0.0 | 0.1 | 0.0 |
| 2022MI165001.P | grass/grasslike | 4 | 0.1-0.2 | 0.1 | 0.2 | 2.2 |
| 2022MI165001.P | grass/grasslike | 5 | 0.2-0.3 | 0.2 | 0.3 | 2.2 |
| 2022MI165001.P | grass/grasslike | 6 | 0.3-0.4 | 0.3 | 0.4 | 2.2 |
| 2022MI165001.P | grass/grasslike | 7 | 0.4-0.5 | 0.4 | 0.5 | 2.2 |
| 2022MI165001.P | grass/grasslike | 8 | 0.5-0.6 | 0.5 | 0.6 | 0.0 |
| 2022MI165001.P | grass/grasslike | 9 | 0.6-0.7 | 0.6 | 0.7 | 0.0 |
| 2022MI165001.P | grass/grasslike | 10 | 0.7-0.8 | 0.7 | 0.8 | 0.0 |
| 2022MI165001.P | grass/grasslike | 11 | 0.8-0.9 | 0.8 | 0.9 | 0.0 |
| 2022MI165001.P | grass/grasslike | 12 | 0.9-1 | 0.9 | 1.0 | 0.0 |
| 2022MI165001.P | grass/grasslike | 13 | 1-1.5 | 1.0 | 1.5 | 0.0 |
| 2022MI165001.P | shrub/vine | 2 | -0.1-0 | -0.1 | 0.0 | 0.0 |
| 2022MI165001.P | shrub/vine | 3 | 0-0.1 | 0.0 | 0.1 | 3.2 |
ggplot(veg.str.pct, aes(x = top, y = X50, col=type)) +
  # plot median
  geom_line() +
  # plot quantiles
  geom_ribbon(aes(ymin = X25, ymax = X75, x = top, fill=type), alpha = 0.2) +
  coord_flip() +
  theme(legend.position = "none")+
  scale_x_continuous(name='height (m)', breaks=c(0:100)*5,  minor_breaks = NULL, limits = c(0,40))+
  scale_y_continuous(name='cover')+
  facet_wrap(~ type, scales = "free_x", nrow=1)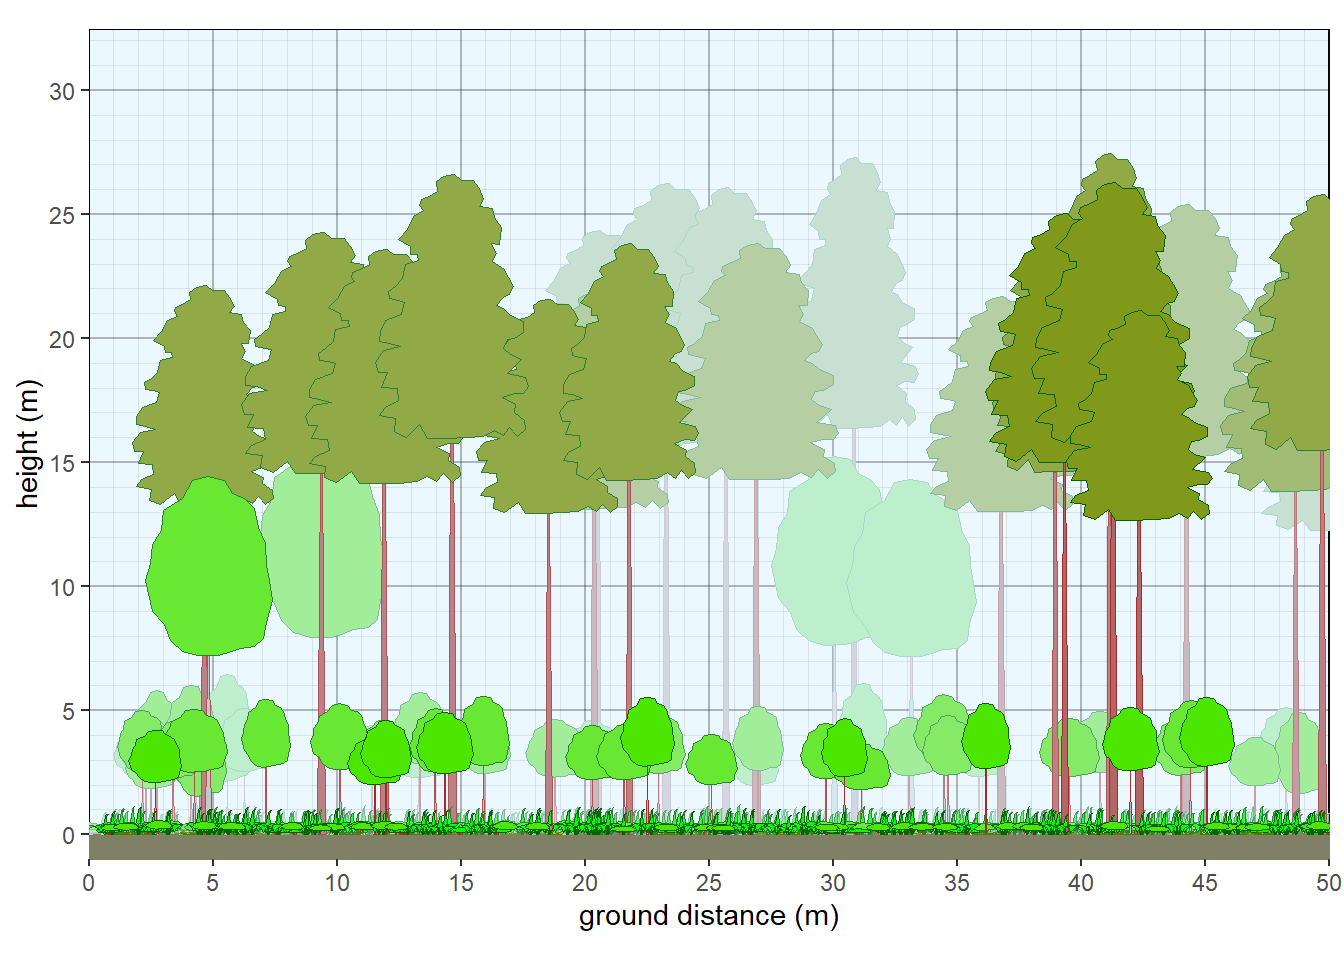
Figure 9.1: Structure of plot collection.
#Custom transformation as a function passing a parameter to existing function. Default sigma of trans = 'pseudo_log' is 1, so in this case, calling the custom function with sigma = 1 is the same as calling trans = 'pseudo_log'. Call custom transformation as trans = 'ps2'. Ggplot appends '_trans' to the name of the function called, so our function needs to have this appended to its name.  But in this data set, trans='sqrt' is preferable as it doesn't overly compress the highest canopy.
ps2_trans <- function() {
  scales::pseudo_log_trans(sigma = 1)
}

ggplot(veg.str.pct, aes(x = top, y = X50, col=type)) +
  # plot median
  geom_line() +
  # plot quantiles
  geom_ribbon(aes(ymin = X25, ymax = X75, x = top, fill=type), alpha = 0.2) +
  coord_flip() +
  theme(legend.position = "none")+
  scale_x_continuous(name='height (m)', breaks=c(c(0:4),c(1:100)*5),  minor_breaks = NULL, limits = c(0,40), trans = 'sqrt')+
  scale_y_continuous(name='cover')+
  facet_wrap(~ type, scales = "free_x", nrow=1)
Figure 9.2: Structure of plot collection, rescaled.
9.4 Functional Vegetation Attributes
A couple of other properties of vegetation to consider is wetness and percent introduced flora.
exo.flora()
- This function determines the percentage cover consisting of flora introduced to the region (presumably since 1492). Can be useful in classifying plots with a high invaded status. Based on state level nativity generalized to regions. If a region is not given, a default nativity for the whole US will be assumed.
get.wetness()
- Function gets mean indicator status, ranging from 0 (all upland) to 1 (all obligate wetland), based on taxon identity and region. If region is not supplied, hydric status will be based on the mean status for all regions rating the taxon.
get.habit.code()
This function looks up a default growth habit (“life form”) code for a taxon. Codes are modified from Appendix E of the US National Vegetation Classification (FGDC (2008)). The first letters indicate stem persistence and height potential:
H = Herbs (rooted forbs and graminoids inclusive);
S = Shrubs, free standing woody plants normally < 5 m tall when mature;
T = Trees, free standing woody plants normally > 5 m tall when mature;
L = Lianas and woody vines normally rooted in the ground and dependent on other plants for structural support;
E = Epiphytes normally not rooted in the ground, established in the branches or trunks of other plants (mostly trees) – can be either parasitic or autotrophic, and includes both woody and herbaceous examples;
N = Nonvascular autotrophs, including bryophytes, lichens, and algae. Most of the time when nonvascular autotrophs are listed in a plot, it is due to their dominance in the ground stratum, however any positive height attributed to the plants should be assumed to be indicate an epiphytic position within the shrub tree stratum, and not the stature of the plant itself, which is always arbitrarily assigned a zero height when on the ground even if some mosses do approach 0.1 m tall.
A significant departure from USNVC is an insertion of a number after “H”, “S”, and “T” to distinguish between:“H1” annuals; “H2” perennials and biennials; “S1” subshrubs and dwarf shrubs; “S2” medium and tall shrubs; “T1” dwarf trees; “T2” medium and tall trees.
Physiognomy
After first letter and size modifier, secondary letters correspond to leaf persistence and size. Some of these include:
BE = Broadleaf evergreen.
BD = Broadleaf deciduous.
NE = Broadleaf evergreen.
ND = Broadleaf deciduous.
F = Forb.
FE = Seedless forb (fern ally).
FV = Herbaceous vine.
GC = Cool season (C3) graminoid.
GW = Warm season (C4) graminoid.
These Characteristics can be used to calculate functional differences among plots.
veg$habitcode <- get.habit.code(veg$taxon)

veg <- veg |> mutate(evergreen = case_when(grepl('NE', habitcode) ~ 1,
                                           grepl('BE', habitcode) ~ 1,
                                           grepl('BD', habitcode) ~ 0,
                                           grepl('ND', habitcode) ~ 0,
                                           TRUE ~ NA_real_))

veg <- veg |> mutate(warmseason = case_when(grepl('GW', habitcode) ~ 1,
                                            grepl('GC', habitcode) ~ 0,
                                            TRUE ~ NA_real_))


veg.functional <- veg |> group_by(plot) |> summarise(evergreen = weighted.mean(evergreen, cover, na.rm = TRUE),
                                                    warmseason = weighted.mean(warmseason, cover, na.rm = TRUE))

knitr::kable(
 veg.functional, booktabs = TRUE,
  caption = 'A table of veg.functional data.'
)| plot | evergreen | warmseason |
|---|---|---|
| 2022MI165001.P | 0.0296296 | 0 |
| 2022MI165002.P | 0.0000000 | 0 |
| 2022MI165003.P | 0.0315259 | 0 |
| 2022MI165004.P | 0.0000000 | … |
| 2022MI165005.P | 0.1776650 | 0 |
| 2022MI165006.P | 0.0000000 | … |
| 2022MI165007.P | 0.1533258 | 0 |
| 2022MI165008.P | 0.0000000 | 0 |
| 2022MI165009.P | 0.0000000 | 0 |
| 2022MI165010.P | 0.5259259 | 0 |
| 2022MI165011.P | 0.0710306 | 0 |
| 2022MI165012.P | 0.7035176 | 0 |
| 2022MI165013.P | 0.0000000 | 0 |
| 2022MI165014.P | 0.4072398 | 0 |
| 2022MI165015.P | 0.2161383 | 0 |
| 2022MI165016.P | 0.5283019 | 0 |
| 2022MI165017.P | 0.2346437 | 0 |
| 2022MI165018.P | 0.0172043 | 0 |
| 2022MI165019.P | 0.1772727 | 0 |
| 2022MI165020.P | 0.6592292 | 0 |
| 2022MI165021.P | 0.5652174 | 0 |
| 2022MI165022.P | 0.4809287 | 0 |
| 2022MI165023.P | 0.6124031 | 0 |
| 2022MI165024.P | 0.2369942 | 0 |
| 2022MI165025.P | 0.4900794 | 0 |
| 2022MI165026.P | 0.0000000 | 0 |
| 2022MI165027.P | 0.0000000 | … |
| 2022MI165028.P | 0.0000000 | 0 |
| 2022MI165029.P | 0.0000000 | 0 |
| 2022MI165030.P | 0.0476190 | … |
| 2022MI165031.P | 0.3819095 | 0 |
| 2022MI165032.P | 0.6353678 | … |
| 2022MI165033.P | 0.0000000 | 0 |
| 2022MI165034.P | 0.0294695 | 0 |
9.5 Ternary Plot of Structure
Different combinations of trees, shrubs, and herbaceous vegetation make for different structural categories. When analyzing strictly from top down, ignoring understory structure (as with remote sensing and LiDAR canopy height models), the total cover adds up to 100%. Tree and shrub cover can be reallocated and displayed on a ternary plot just like soil texture. ‘Open’ is used instead of herb cover to ensure that numbers add up to 100.
veg <- veg  |> mutate(tree = ifelse(type %in% c('tree', 'shrub/vine') & ht.max > 5,cover,0),
                      woody = ifelse(type %in% c('tree', 'shrub/vine'),cover,0))

veg.tern <- veg |> group_by(plot) |> summarise(tree = cover.agg(tree), woody = cover.agg(woody), shrub = woody - tree, open = 100 - woody)

veg.tern <- veg.tern |> cbind(vegnasis::totriangle(a=veg.tern$tree, b=veg.tern$shrub))
Figure 9.3: Ternary plot of vegetation structure.
Alternatively, we can define breaks between categories and add to the background of the plot.
s1 <- data.frame(open = c(35,0,0),
                 tree = c(65,100,65),
                 shrub = c(0,0,35), group="1 forest")

s2 <- data.frame(open = c(25,25,0,0),
                 tree = c(10,65,65,10),
                 shrub = c(65,10,35,90), group="2 dense scrubby woodland")

s3 <- data.frame(open = c(80,25,25),
                 tree = c(10,65,10),
                 shrub = c(10,10,65), group="3 open scrubby woodland")

s4 <- data.frame(open = c(90,35,25,80),
                 tree = c(10,65,65,10),
                 shrub = c(0,0,10,10), group="4 open woodland/savanna")

s5 <- data.frame(open = c(25,25,0,0),
                 tree = c(0,10,10,0),
                 shrub = c(75,65,90,100), group="5 shrub thicket")

s6 <- data.frame(open = c(90,80,25,25),
                 tree = c(0,10,10,0),
                 shrub = c(10,10,65,75), group="6 open shrubland")

s7 <- data.frame(open = c(100,90,80,90),
                 tree = c(0,10,10,0),
                 shrub = c(0,0,10,10), group="7 open grassland")


  str.polys = rbind(s1,s2,s3,s4,s5,s6,s7)
  str.polys <- totriangle(str.polys$tree, str.polys$shrub) |> cbind(group=str.polys$group)

vtern(background = F) +
  geom_polygon(data=str.polys, aes(fill=group, x=x, y=y),alpha=0.25,size=0.1, color='black') +
  geom_point(data=veg.tern, aes(x=x, y=y))+
  scale_fill_manual(values=c('darkcyan','darkgreen','green','yellowgreen','red','orange','yellow')) +
  theme(legend.position=c(0,1),legend.justification=c(0,1)) +
  labs(fill="Vegetation Structure")
Figure 9.4: Ternary plot of vegetation structure with categories.